

HOT TOPICS LIST
- MACD
- Fibonacci
- RSI
- Gann
- ADXR
- Stochastics
- Volume
- Triangles
- Futures
- Cycles
- Volatility
- ZIGZAG
- MESA
- Retracement
- Aroon
INDICATORS LIST
LIST OF TOPICS
PRINT THIS ARTICLE
by Mark Rivest
Yield for US 30-Year Treasury Bonds has reached powerful resistance. What are sentiment and momentum indicators telling us at this juncture?
The most interesting market to watch for the remainder of March could be US 30-Year Treasury Bond and its yield as measured by CBOE Treasury Yield 30-Year Index (TYX). A break above the 3.26 level could trigger a move to at least 3.90. Evidence from the dimensions of sentiment and momentum offer clues to what may happen in the several weeks.
Position: N/A
Mark Rivest
Independent investment advisor, trader and writer. He has written articles for Technical Analysis of Stocks & Commodities, Traders.com Advantage,Futuresmag.com and, Finance Magnates. Author of website Four Dimension Trading.
PRINT THIS ARTICLE
FIBONACCI
Bond Yield Decision Point
03/22/17 04:30:28 PMby Mark Rivest
Yield for US 30-Year Treasury Bonds has reached powerful resistance. What are sentiment and momentum indicators telling us at this juncture?
The most interesting market to watch for the remainder of March could be US 30-Year Treasury Bond and its yield as measured by CBOE Treasury Yield 30-Year Index (TYX). A break above the 3.26 level could trigger a move to at least 3.90. Evidence from the dimensions of sentiment and momentum offer clues to what may happen in the several weeks.
Position: N/A
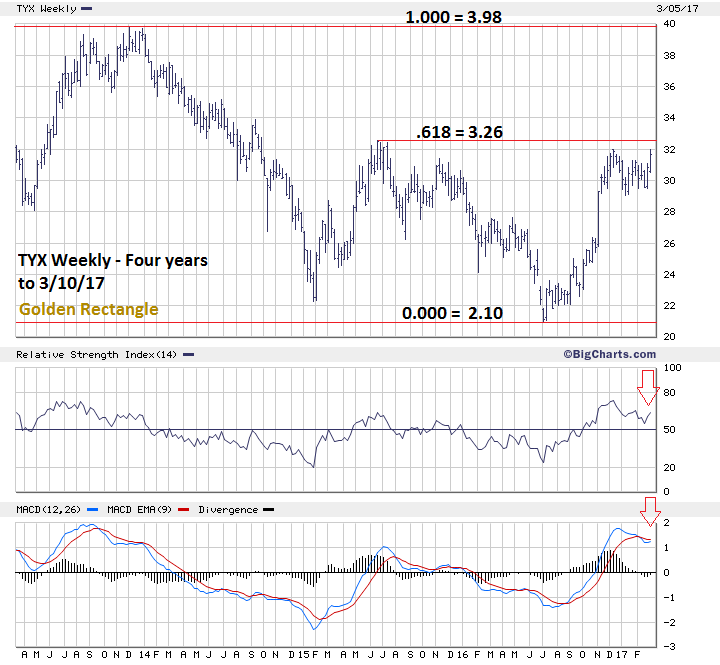
| 30-Year Yield In my January 18th article "The Prospect for Higher Interest Rates and Inflation", I noted that a new secular bull market for bond yield may have begun, and that the TYX needed to overcome two price hurdles. The first is to move beyond 3.25 and the second, a move above 3.98, would confirm a secular bull market for bond yield was underway. Please see the Weekly TYX chart illustrated in Figure 1. Over the last four years, TYX has formed a fascinating Fibonacci "Golden Rectangle" with the peak at 3.26 made in June 2015 as the dividing line. This level offers powerful resistance and a breech may open the door to a multi-month move to at least 3.90. The FOMC meeting March 14-15 could be the catalyst for a move up, or possibly begin a new down move. The weight of evidence give us a clue as to near term direction. On March 10th TYX reached the last significant peak at 3.20 made in December 2016. Note that both the daily RSI and MACD are in position to record bearish divergences on a move above 3.20. |
|
| Figure 1. Over the last four years TYX has formed a fascinating Fibonacci �Golden Rectangle�. |
| Graphic provided by: BigCharts.com. |
| |
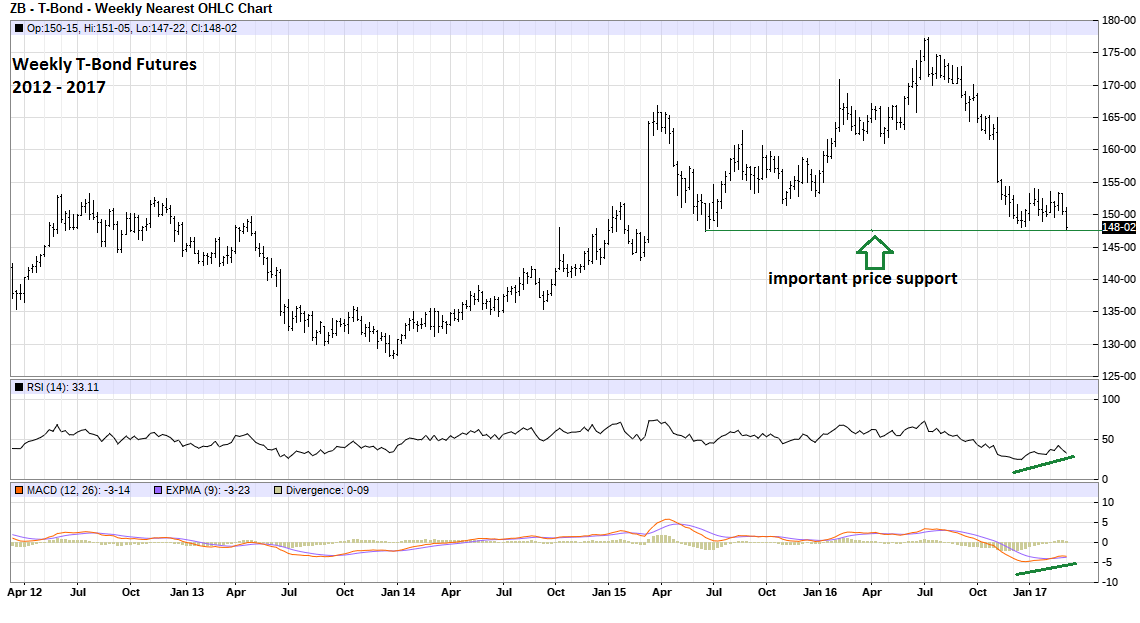
| 30-Year Treasury Bond The message is the same for the T-Bond futures prices which are the inverse of yield. Please see the Weekly T-Bond chart illustrated in Figure 2. Note the weekly RSI and MACD have registered significant bullish divergences. Also, on the weekly Commitment of Traders report (not shown) for T-Bond futures, Commercials have nearly the highest net long position since the last major price bottom made in late 2013. Commercials have the most money and are the group to follow. The only significant indicator that is bearish for T-Bond futures is the Market Vane Bullish Consensus. Every week Market Vane polls traders in various markets to get a consensus reading. High percentage readings are an indication that there's excessive bullishness and a market could be at a top. A low consensus reading can mean excessive bearishness and a market bottom. At the last significant T-Bond top in mid-2016, the Bullish Consensus was 83%. The lowest reading after the multi month price decline was only 58%, while the most current reading is 60%. This is the upper end of the neutral zone and not near the type of reading you would expect at a price bottom. This implies that T-Bond futures could soon be heading lower, and correspondingly yield will head higher. |
|
| Figure 2. Note the weekly RSI and MACD have registered significant bullish divergences. |
| Graphic provided by: Barcharts.com. |
| |
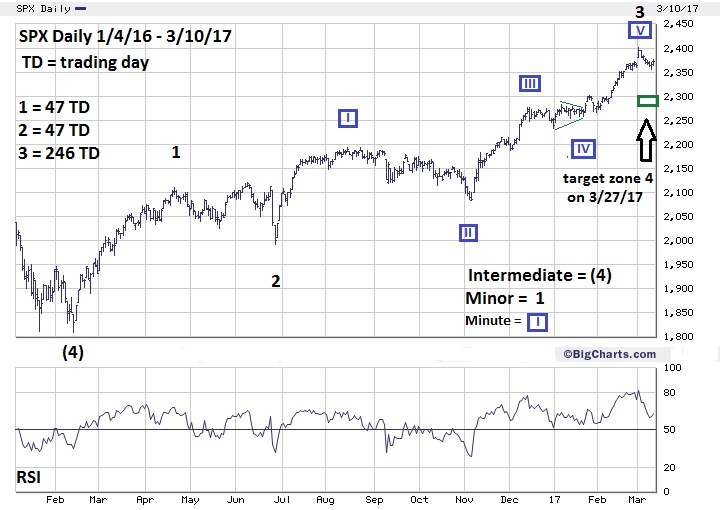
| S&P 500 For several weeks, Elliott wave analysis for the S&P 500 (SPX) has been difficult. This situation has cleared up with some fascinating Fibonacci time and price relationships. Please see the daily SPX chart illustrated in Figure 3. The first clue comes from the supposed Minor wave "2" which began on April 20, 2016 and terminated on the June 27, 2016 Brexit bottom. Please see my June 24, 2016 article "The Brexit Factor". Minor wave "2" was an Elliott wave Double Zigzag in which the middle wave, referred to as an "X" wave, moved above the termination point of Minor wave "1" at SPX 2111.10. Minor wave "2" was 47 trading days, the same number of trading days as Minor wave "1" from the February 11, 2016 bottom. This is an example of wave equality. The fascinating part comes from the 246 trading days of the supposed Minor wave "3" which began at the June 27th bottom and terminated on March 1, 2017. Adding the time of Minor waves "1" and "2" yields 94 trading days. Dividing 94 by 246 equals .382, a bulls-eye Fibonacci relationship! Additional evidence that Minor wave "3" may have peaked on March 1st come from a price relationship within Minute wave "V" of Minor wave "3". The January 23-26 rally of 44 points looks like the first sub wave of Minute wave "V". Adding 44 points to the February 28th bottom of 2359.00 targets SPX 2403.00, only three points from round number resistance and only two points from the 2401.00 top. The typical relationship between waves "two" and "four" is equality. However, if Minor wave "4" is forming from the 2401.00 peak it is happening during a seasonally bullish time which could last until May. It's possible Minor wave "4" could be shorter in time than Minor wave "2" of 47 trading days. 47 multiplied by .382 = 18 trading days. Adding 18 days to March 1st targets March 27th, a new moon day, as the bulls-eye time target for Minor wave "4". The price target could be a .382 retracement of the rally from November 4th at 2083.80 to 2401.00. The bulls-eye target is SPX 2279.80. This decline would be 121.20 points, close to equal the 128.90-point decline of Minor wave "2". The broader target zone is SPX 2270-2300. |
|
| Figure 3. The bulls-eye target is SPX 2279.80. This decline would be 121.20 points, close to equal the 128.90-point decline of Minor wave �2�. |
| Graphic provided by: BigCharts.com. |
| |
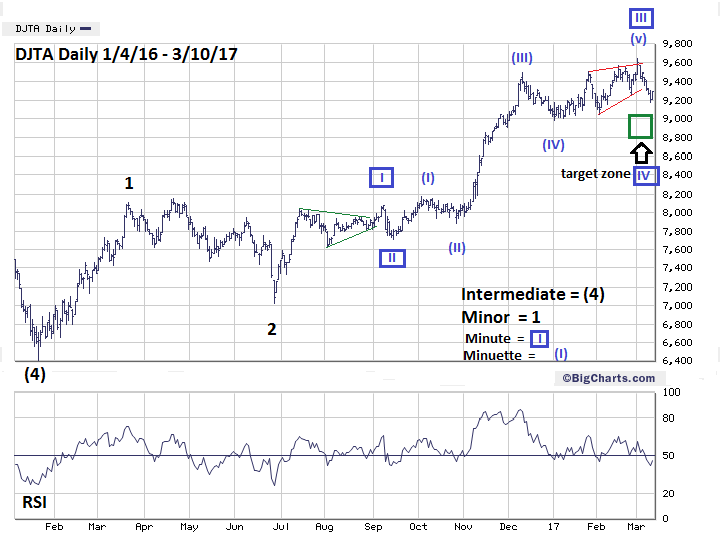
| Dow Jones Transportation Average (DJTA) Please see the DJTA daily chart illustrated in Figure 4. Because of the DJTA's incredibly clear Elliott wave count it's the most important index to follow. The DJTA wave count development is probably lagging the SPX, meaning that the SPX will complete its Minor wave "5" up from the February 11, 2016 bottom before the DJTA reaches its Minor wave "5" top. There's precedent for this phenomenon — in 2008 the DJTA reached its bull market peak seven months after the SPX. In the current cycle, I suspect the difference could be measured in weeks not months. If this scenario plays out it could give us some incredibly important information of a potentially big move later in 2017. Keep watching the DJTA. |
|
| Figure 4. Because of the DJTA�s incredibly clear Elliott wave count it�s the most important index to follow. |
| Graphic provided by: BigCharts.com. |
| |
| Summary The weight of evidence from TYX and T-Bond futures point to declining yields for the next several weeks. However, when using Fibonacci analysis allow for leeway around a price target. If within the next week TYX was to exceed 3.39 the probabilities will shift, opening the door to a multi-month move to at least the 3.90 area. In the last two articles, I've used the tag line from the television series "The X Files": "The truth is out there". The fascinating SPX Fibonacci time relationships since early 2016 again proves that the truth to the markets is out there and can be discovered by anyone. Further Reading: Frost A.J and Robert Prechter (1985) "Elliott Wave Principle", New Classics Library. Hadady R. Earl (1983) "Contrary Opinion", Key Books. |
Independent investment advisor, trader and writer. He has written articles for Technical Analysis of Stocks & Commodities, Traders.com Advantage,Futuresmag.com and, Finance Magnates. Author of website Four Dimension Trading.
| Website: | www.fourdimensiontrading.com |
| E-mail address: | markrivest@gmail.com |
Click here for more information about our publications!
PRINT THIS ARTICLE

Request Information From Our Sponsors
- StockCharts.com, Inc.
- Candle Patterns
- Candlestick Charting Explained
- Intermarket Technical Analysis
- John Murphy on Chart Analysis
- John Murphy's Chart Pattern Recognition
- John Murphy's Market Message
- MurphyExplainsMarketAnalysis-Intermarket Analysis
- MurphyExplainsMarketAnalysis-Visual Analysis
- StockCharts.com
- Technical Analysis of the Financial Markets
- The Visual Investor
- VectorVest, Inc.
- Executive Premier Workshop
- One-Day Options Course
- OptionsPro
- Retirement Income Workshop
- Sure-Fire Trading Systems (VectorVest, Inc.)
- Trading as a Business Workshop
- VectorVest 7 EOD
- VectorVest 7 RealTime/IntraDay
- VectorVest AutoTester
- VectorVest Educational Services
- VectorVest OnLine
- VectorVest Options Analyzer
- VectorVest ProGraphics v6.0
- VectorVest ProTrader 7
- VectorVest RealTime Derby Tool
- VectorVest Simulator
- VectorVest Variator
- VectorVest Watchdog
 Follow
us on Twitter
Follow
us on Twitter
DEPARTMENTS: Advertising | Editorial | Circulation | Contact Us | BY PHONE: (206) 938-0570
PTSK — The
Professional Traders' Starter Kit
Home — S&C
Magazine | Working
Money Magazine | Traders.com
Advantage | Online Store | Traders’ Resource
Add a Product
to Traders’ Resource | Message
Boards | Subscribe/Renew | Free
Trial Issue | Article
Code | Search
Copyright © 1982–2024 Technical Analysis, Inc. All rights reserved. Read our disclaimer & privacy statement.